Warsaw University of Technology
Grade: Postgraduate Degree
Faculty: Data Science


I am a Business Intelligence Specialist based in Krakow, Poland. I am passionate about using data to drive strategic decisions. With expertise in project management, data analysis, and visualization, I transform complex data into actionable insights.
Enterprise Projects
Datasets Analyzed
Dashboards Delivered
Automations Built
Transforming raw data into actionable insights through analysis, visualization, and reporting to drive smarter decisions.
Creating interactive dashboards and reports to visualize data, enabling informed business decisions.
Building efficient solutions and automating workflows to enhance productivity and streamline processes.
Do you want to explore the world of data together? Click here to contact me! 👋
Grade: Postgraduate Degree
Faculty: Data Science
Grade: Postgraduate Degree
Faculty: Production Management
Grade: Engineer's Degree
Faculty: Food Technology and Human Nutrition
Skills: Microsoft Power BI · Microsoft Power Apps · Microsoft Power Automate · SQL · Python
Skills: Microsoft Power BI · Microsoft Power Apps · SQL · Visual Basic for Applications (VBA)
Skills: Microsoft Power BI · Microsoft Power Apps · SQL · Project Management

A Power BI dashboard designed to give a clear, consolidated view of factory performance across production, safety, quality, environmental metrics, and waste. It brings together key operational indicators into one structured report, helping stakeholders quickly spot deviations, monitor efficiency, and identify areas needing attention.
The dashboard transforms raw operational data into intuitive visual insights, enabling faster recognition of performance trends, bottlenecks, and risks. By standardizing the way factory metrics are presented, it improves transparency across teams and supports more consistent decision-making.
View Dashboard
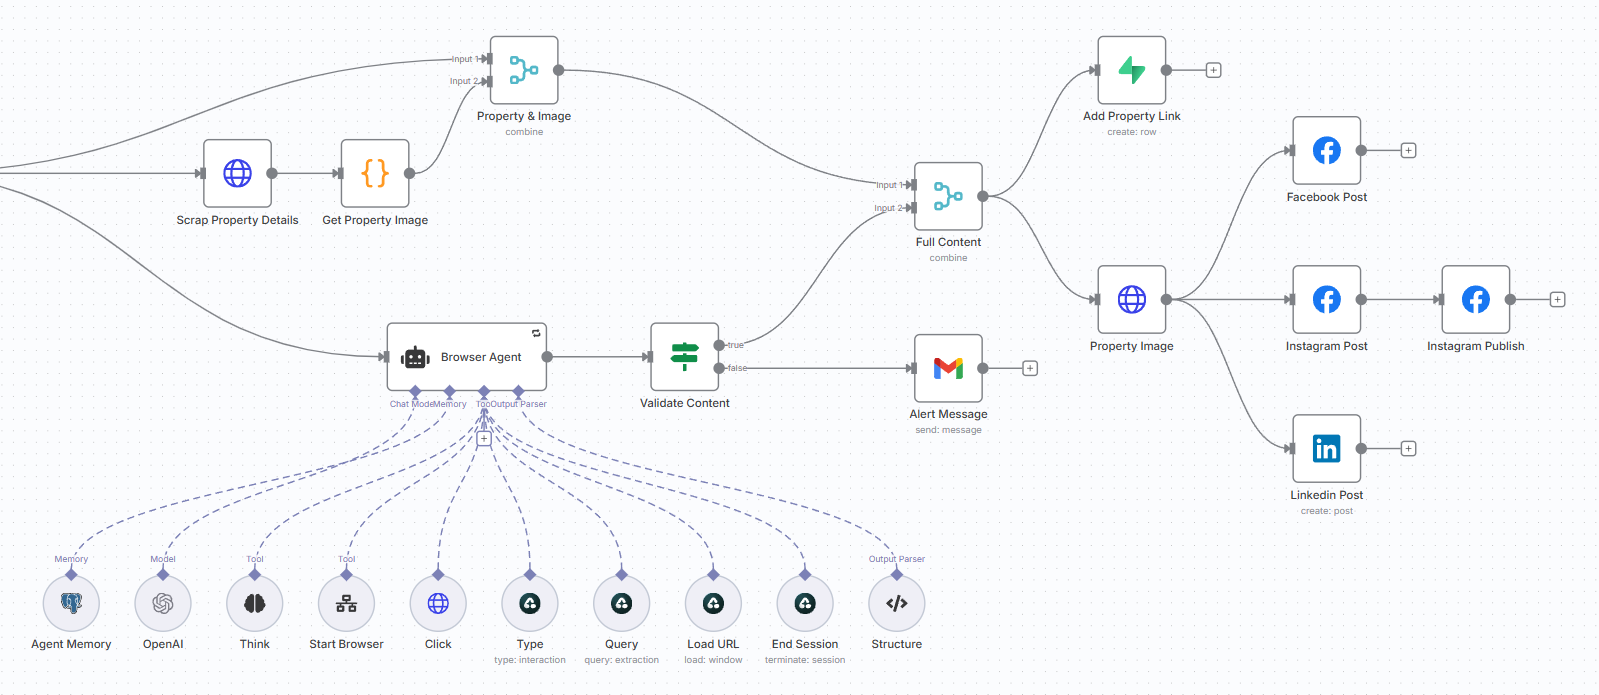
This project showcases a custom AI Flow designed to automate the end-to-end process of publishing real estate listings across social media platforms. The workflow begins with a scheduled trigger that scrapes property links from a real estate website.
These details are then validated and enriched by the AI Agent, ensuring the content is accurate and tailored for social media. The agent combines structured data and images into formatted posts and automatically publishes them to Facebook, Instagram, and LinkedIn. The result is highly scalable and redefines how real estate listings are promoted online.
More Details
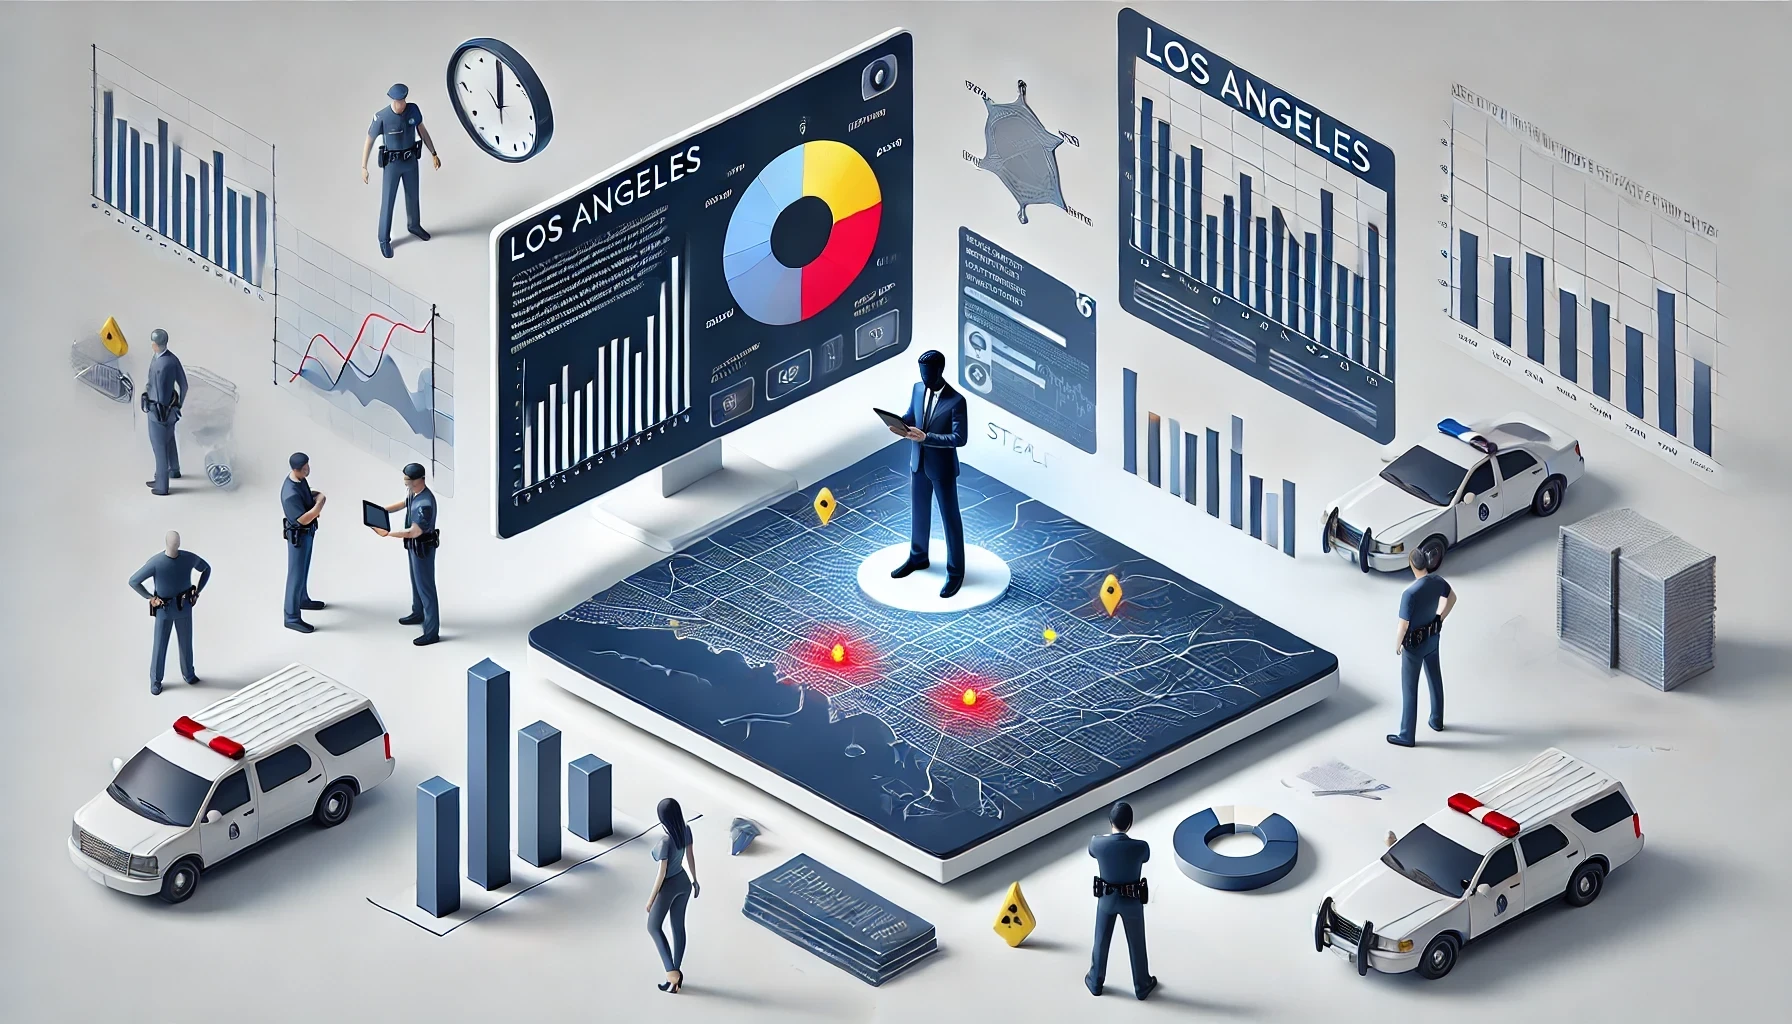
This interactive dashboard provides insights into crime trends in Los Angeles from 2020 to 2023. It visualizes key metrics such as crime distribution by area, types of offenses, weapon usage, and victim demographics.
Designed with user-friendly navigation, the dashboard allows for quick exploration of data to support informed decision-making. Built using Power BI, it showcases advanced data visualization techniques and analytical capabilities.
View Dashboard

The Nobel Prize has been among the most prestigious international awards since 1901. Each year, awards are bestowed in chemistry, literature, physics, physiology or medicine, economics, and peace.
In addition to the honor, prestige, and substantial prize money, the recipient also gets a gold medal with an image of Alfred Nobel (1833 - 1896), who established the prize.
View on GitHub
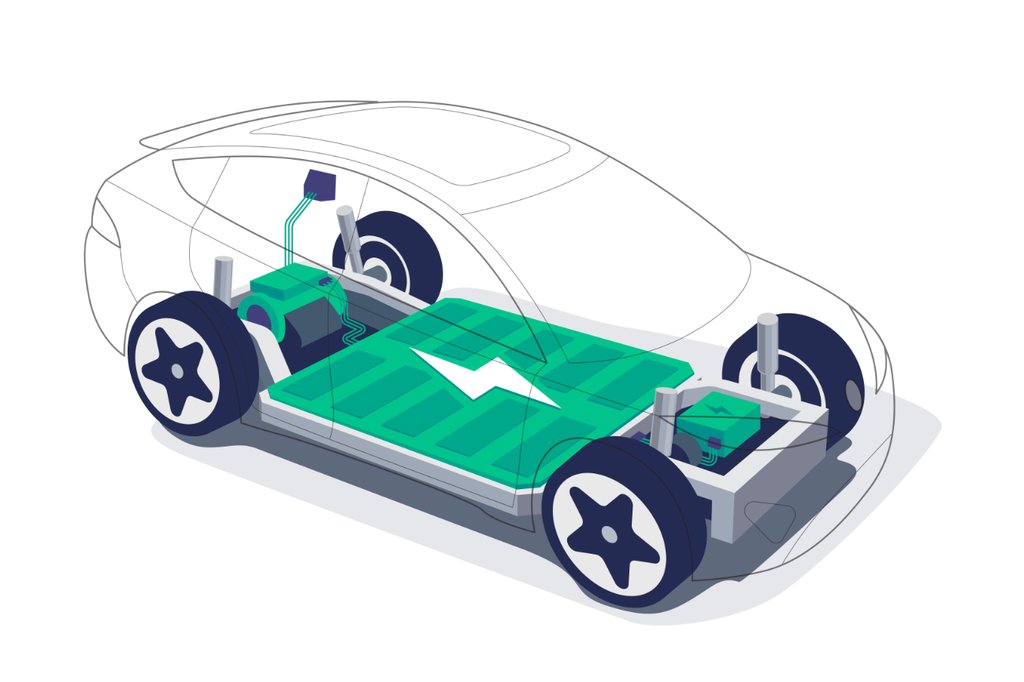
The US Government's Alternative Fuels Data Center collects records of electric vehicle (EV) charging infrastructure, including charging ports and station locations, as well as sales of electric vehicles. With the EV market rapidly evolving, understanding trends in charging facilities and sales is essential to inform strategic planning.
View on GitHub
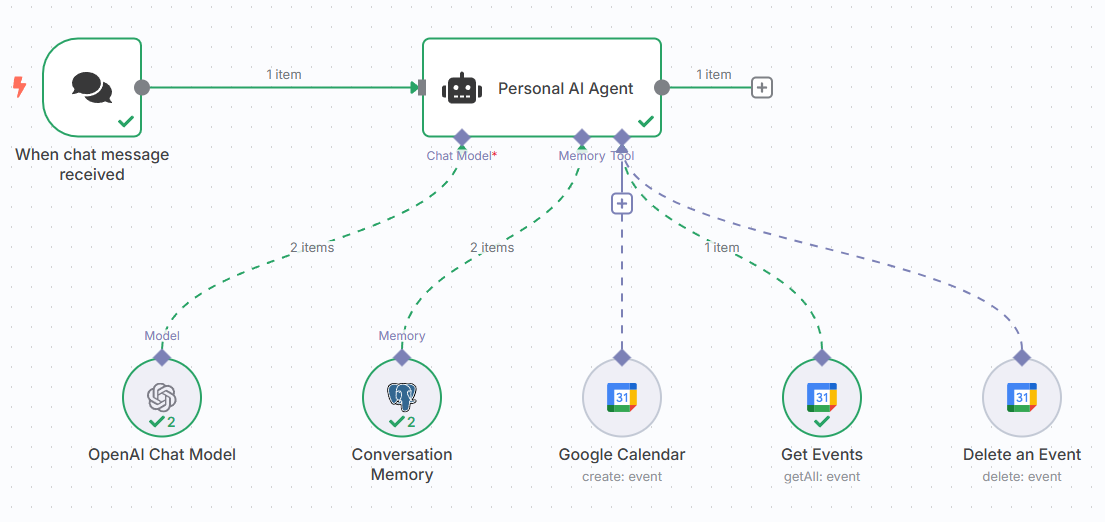
I designed and implemented an intelligent Personal AI Assistant using the n8n automation platform, integrating OpenAI's Chat Model with Google Calendar. The agent is capable of understanding natural language chat input, retaining context with conversation memory, and performing real-time calendar operations.
More Details
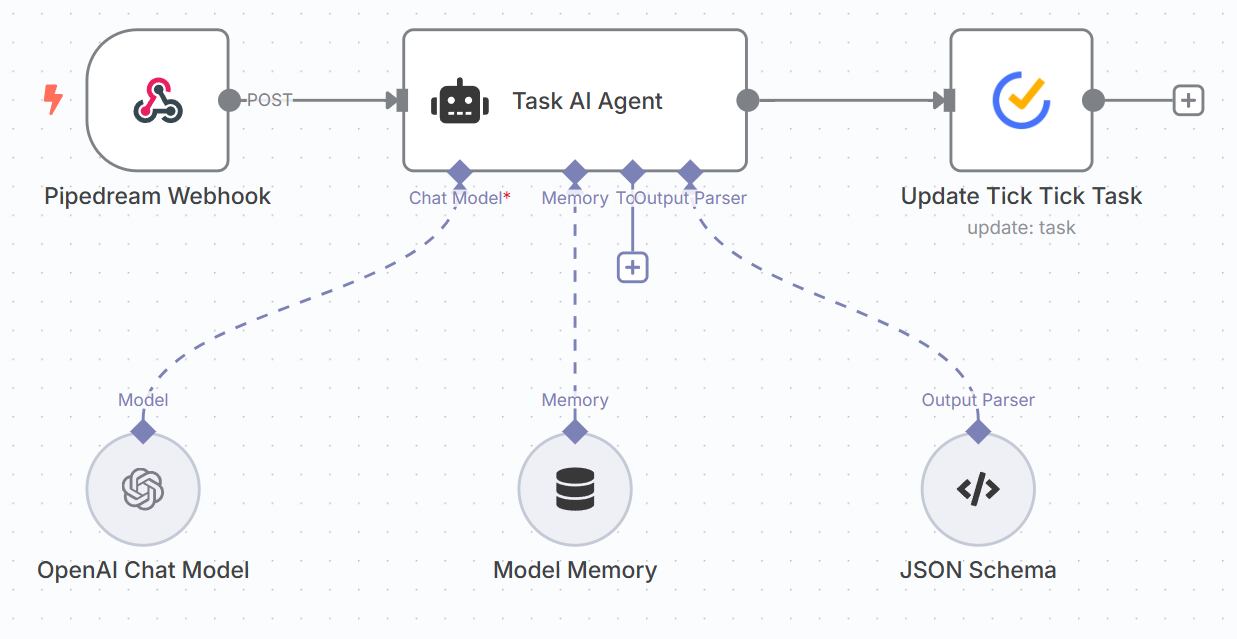
This project features a custom AI Flow that automates task updates in TickTick based on natural language input. The process begins with a webhook built in Pipedream, which captures real-time requests from external sources. These requests are passed to an AI Agent powered by OpenAI's chat model, which interprets the user's intent and extracts structured task details like title and description.
The agent formats the data using a JSON schema and uses memory for context-aware interactions. It then sends the final task to the TickTick API, where it is automatically updated, resulting in a seamless and intelligent workflow.
More DetailsMastered data visualization and analysis with Power BI 🚀. Gaining the skills to transform complex data into actionable insights. View my certificate here.
Mastered SQL fundamentals and advanced querying 🔥. Gained the skills to analyze, manage, and transform data effectively. View my certificate here.
Learned to create applications and automate tasks with Power Apps. Acquired expertise in improving and streamlining operations ⚡. View my certificate here.
Learned to analyze datasets with Python 🐍. Gained skills to uncover insights and drive decisions. View my certificate here.
Mastered creating stunning data visualizations with Python. Developed skills to present insights clearly and effectively 💡. View my certificate here.
Built a strong foundation in Python for Data Science 🧠. Acquired essential skills for data analysis and machine learning. View my certificate here.
Learned to leverage the OpenAI API 🤖. Gained skills to integrate AI capabilities into applications and automate tasks. View my certificate here.
Built strong data analysis skills using Python 🐍. Learned to clean, manipulate, and visualize data with tools like Pandas and Matplotlib. View my certificate here.
Gained hands-on experience in data analysis with R 📈. Focused on data wrangling and visualization using tidyverse tools. View my certificate here.
Gained practical skills in Alteryx 🎯 by designing workflows to automate data cleansing, blending, and analysis 📊. View my certificate here.
Don't like forms? Send me an email. 👋